The main components of the dashboard are organized as a hierarchy of the data collection system. In this system, users have projects which is a collection of devices, which is a collection of sensors. Thus depending on which project you are viewing will determine which devices you will be able to view and thus depending on which device you are viewing will determine which sensors you will be able to view.
Projects
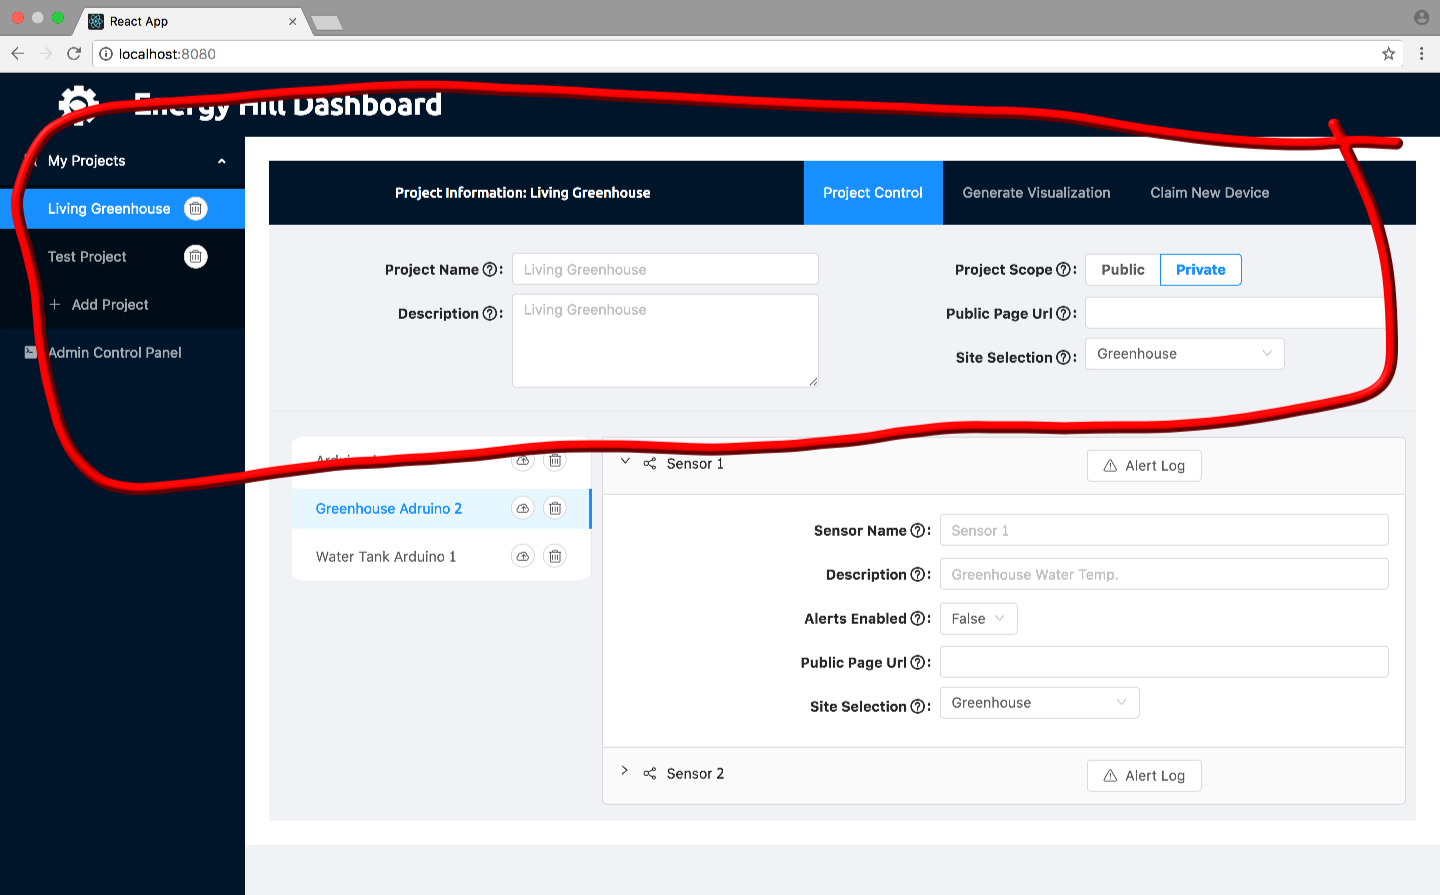
Most of the content on the dashboard is dependent on which project you are viewing. To choose a project to view, click on one of the projects that you own in the column labeled “My Projects” on the left (circled in red below).

Once clicking one of those options will populate all of the content on the right. Here on the right, in the red highlighted section, you can change the properties of the project that you have selected. The text boxes and drop-down at the top are pertaining specifically to the project while the other stuff below is for the selected project, but also dependent on which device you are looking at. More details on this in sections below.
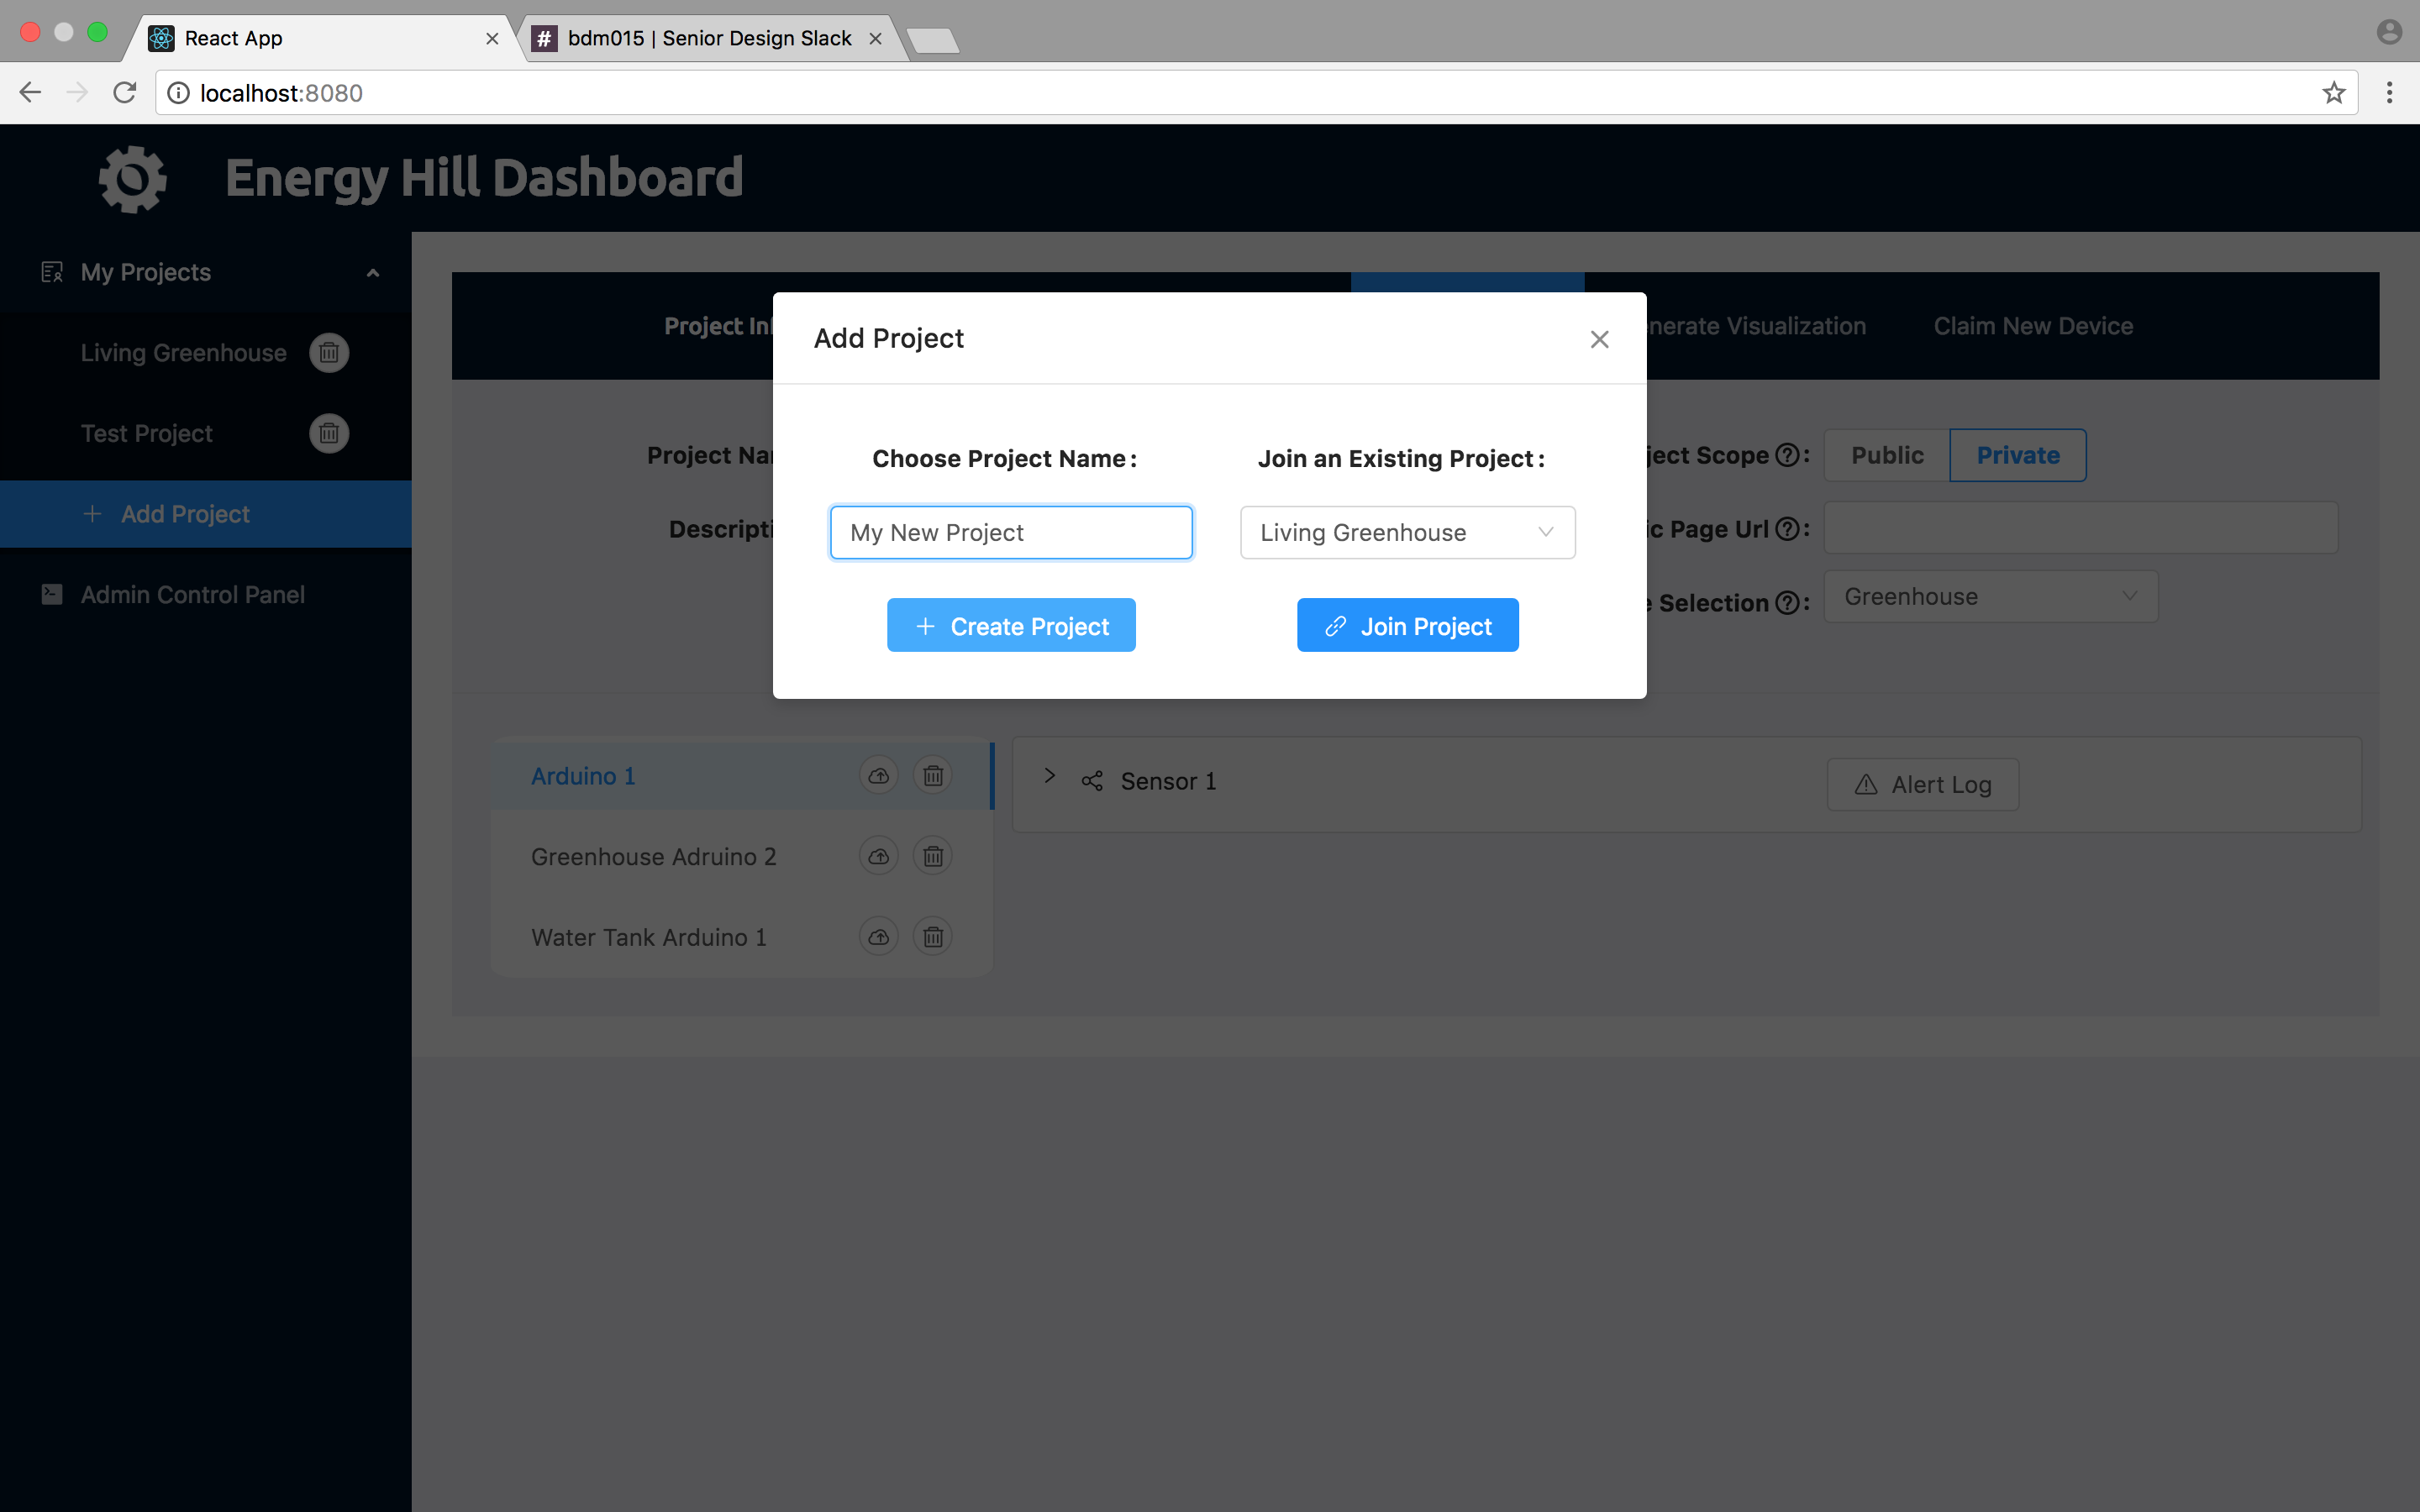
In terms of projects, you will need to add or join a project at some point. To do this, click the bottom in the left column that says “Add Project” and this will create the popup shown below. Here you can create a new project from scratch or join an existing one.
Devices
Once you have chosen a project, the dashboard will populate the red circled area with the devices that belong to the selected project. Here you can select which ever device you want to inspect or modify.
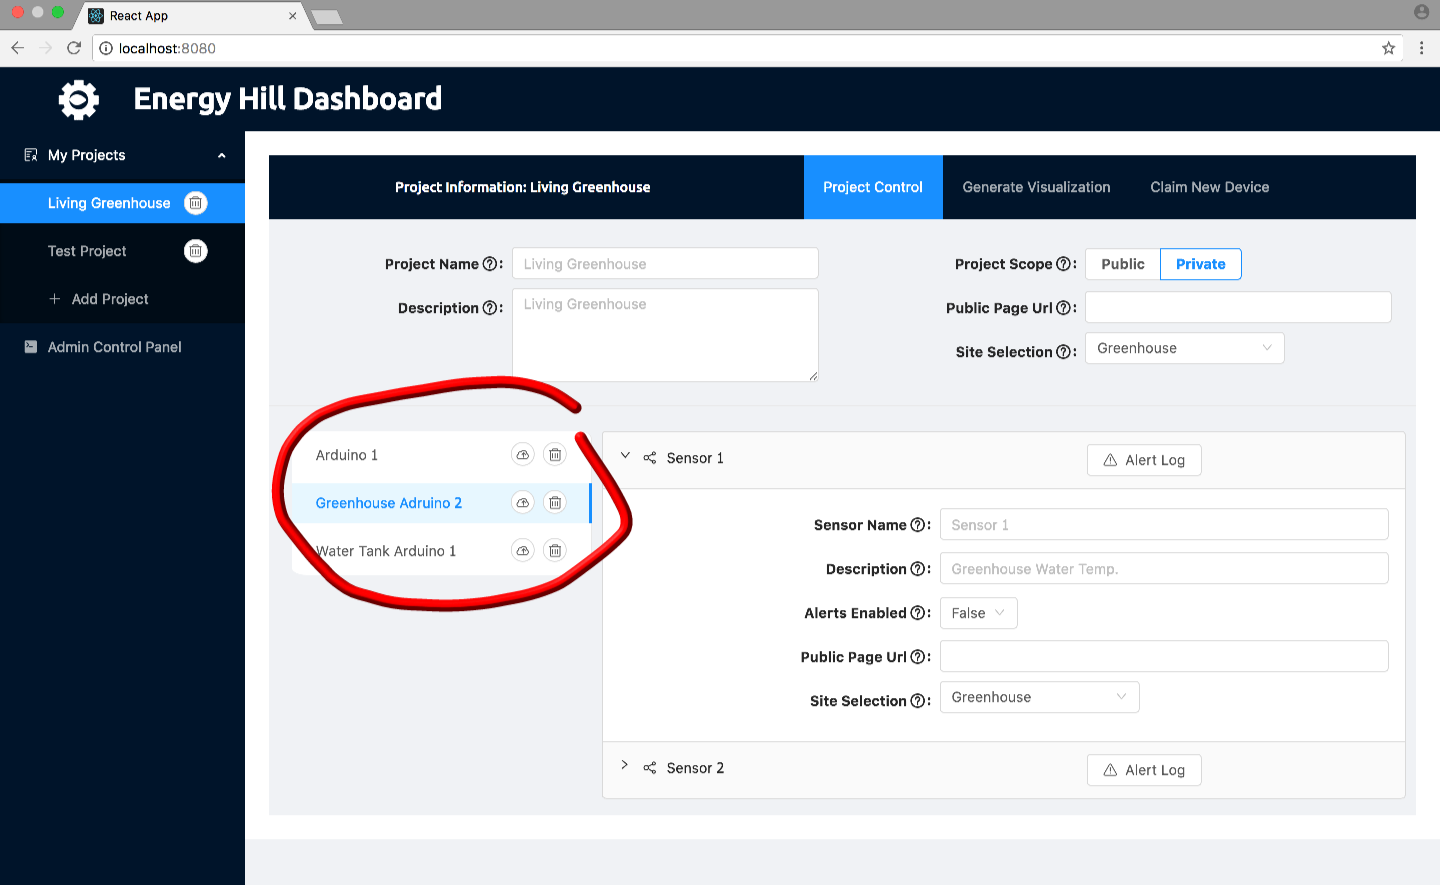
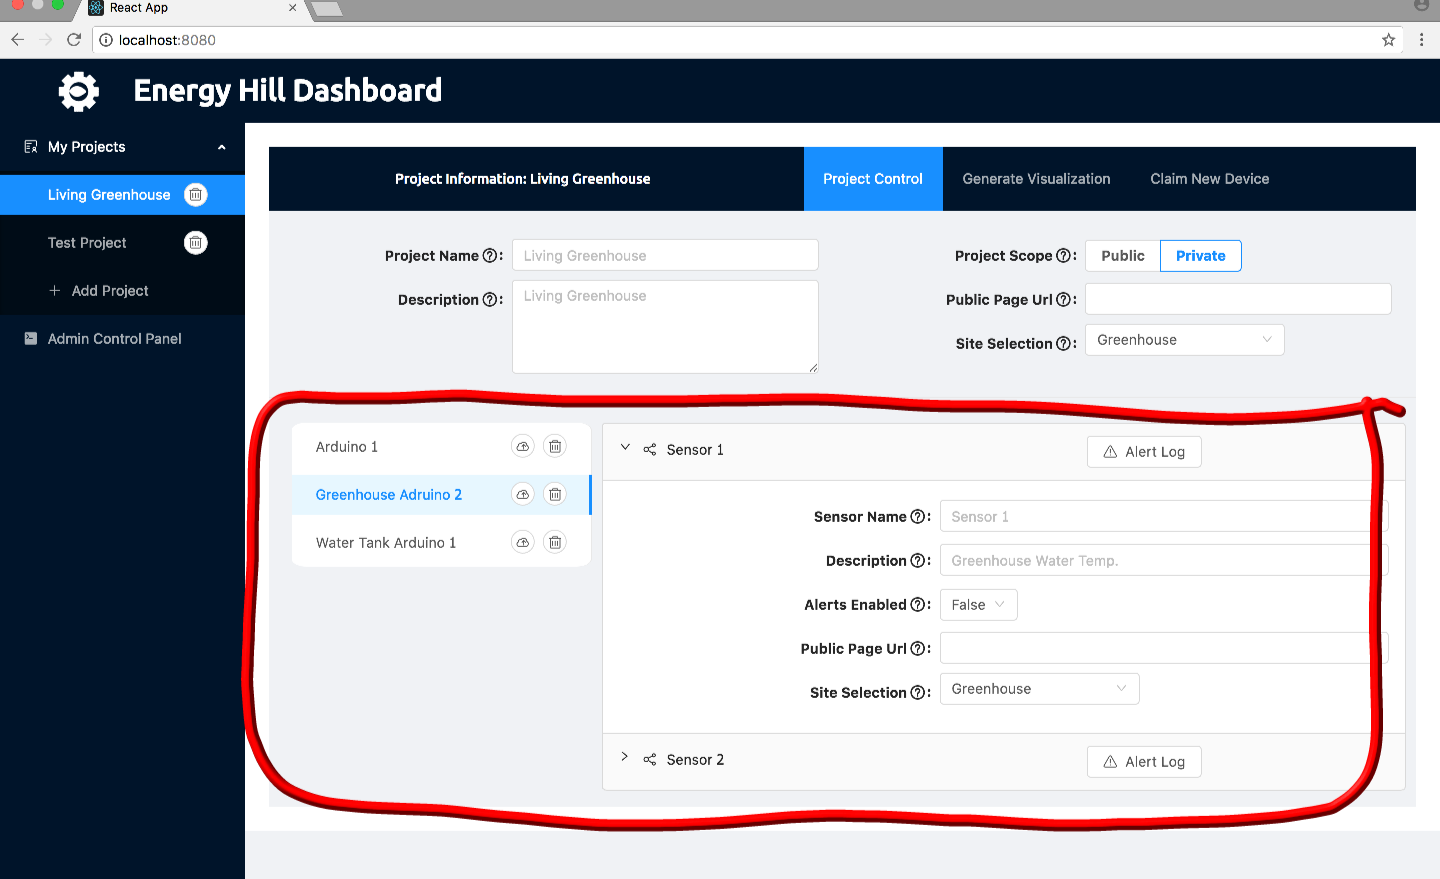
Now you have chosen the device you want to display and edit, the content in the red circled below will pertain to that device.
Sensors
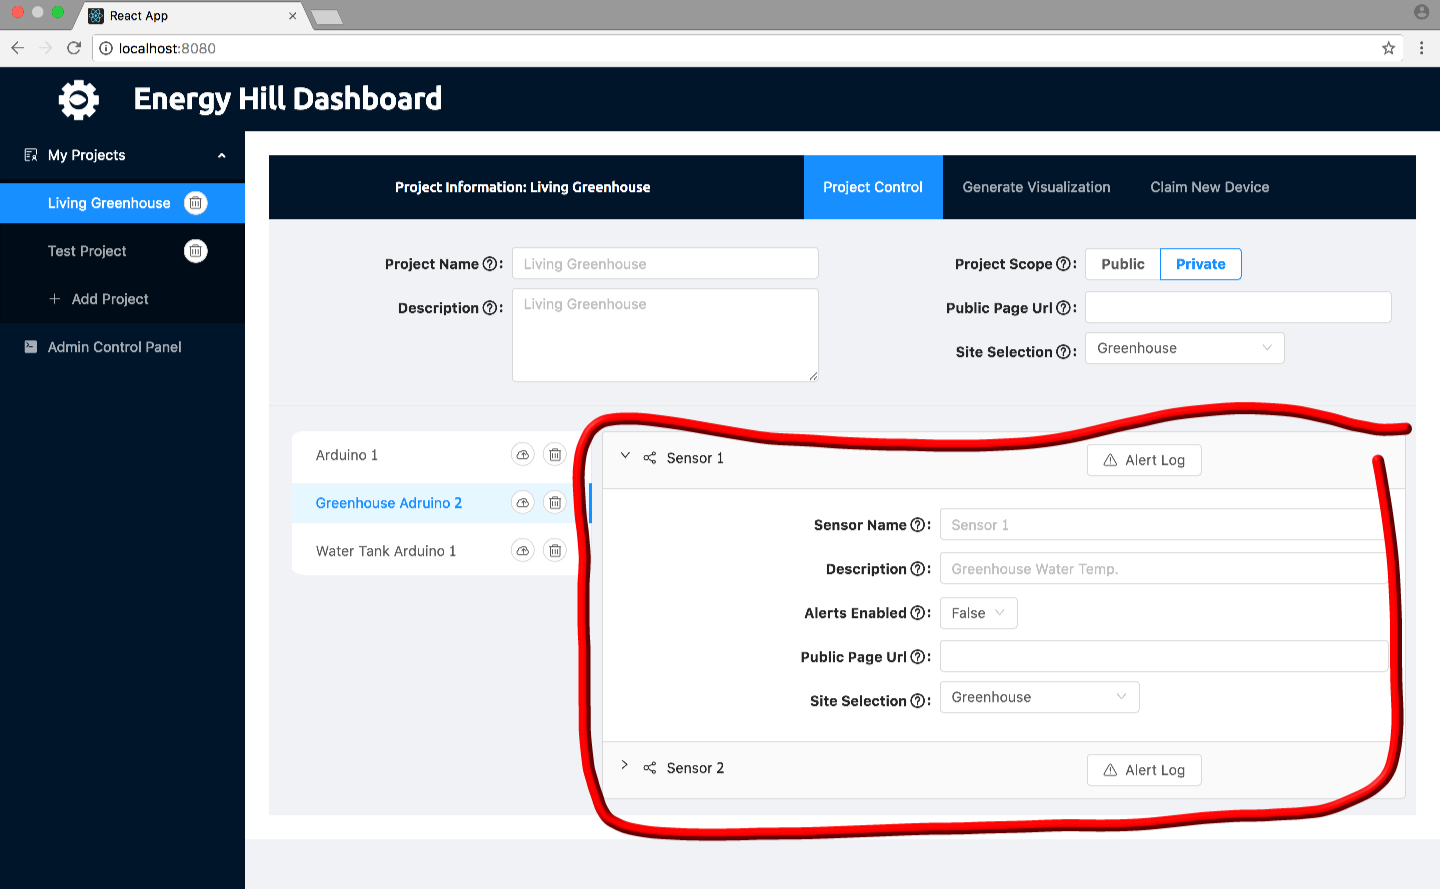
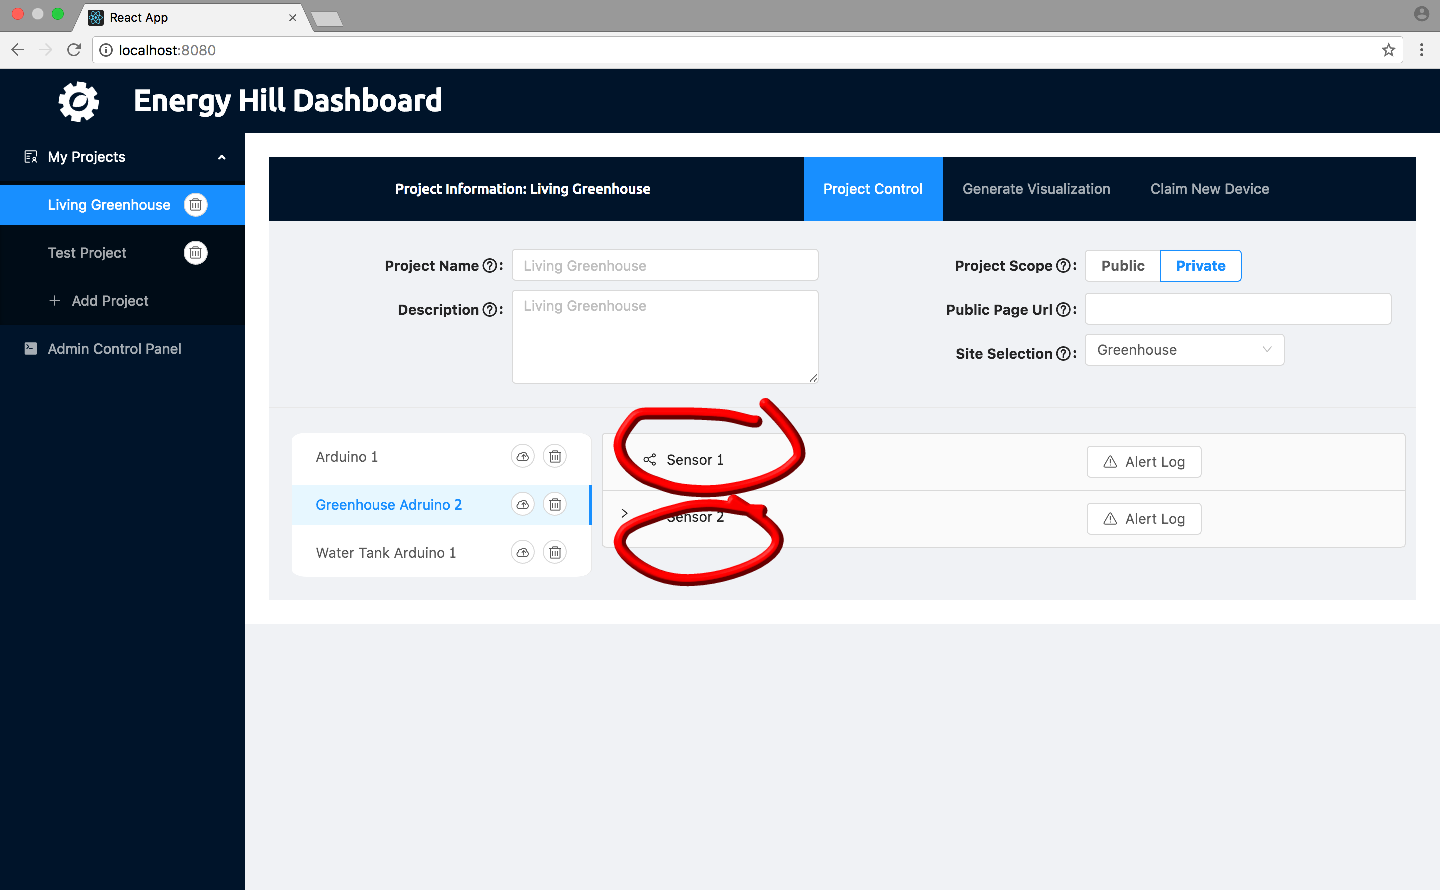
Finally, once you have chosen which device you want to inspect, you can drill down to look at and edit specific sensor information. To do this, click on the arrow next to any of the sensor names. This clickable area is highlighted in red below.
After doing this, it will expand to have all the information for that sensor. The panel circled below is for changing the properties of your sensors. The Sensor Name and Units fields are aesthetic options that are used in your data visualizations. The lower and upper limit fields are used for email alerts. If your sensor is outputting a value that average over the upper limit or under the lower limit for 10 minutes, that is what will trigger an email alert.
